eCommerce
Sales
About Project
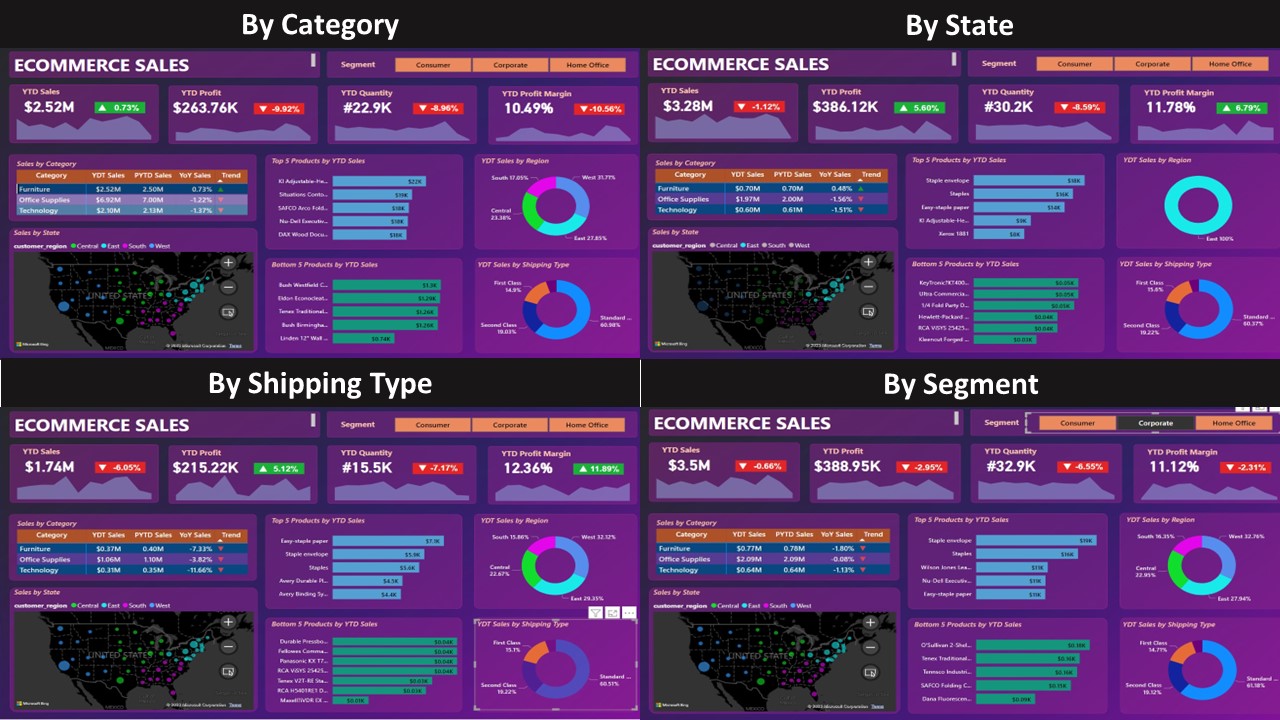
This is a Power BI project that shows insights of eCommerce Sales. Since the Premium account requires payment, this way has been choosen to give detailed information about the project. The dashboard is absolutaly dynamic and by changing Category, Segment, State or Shipping Type, the values are also changing properly. Here is overview of the dashboard by choosen 4 different aspects. As we can see all the values are dynamic depending on mentioned parameters:
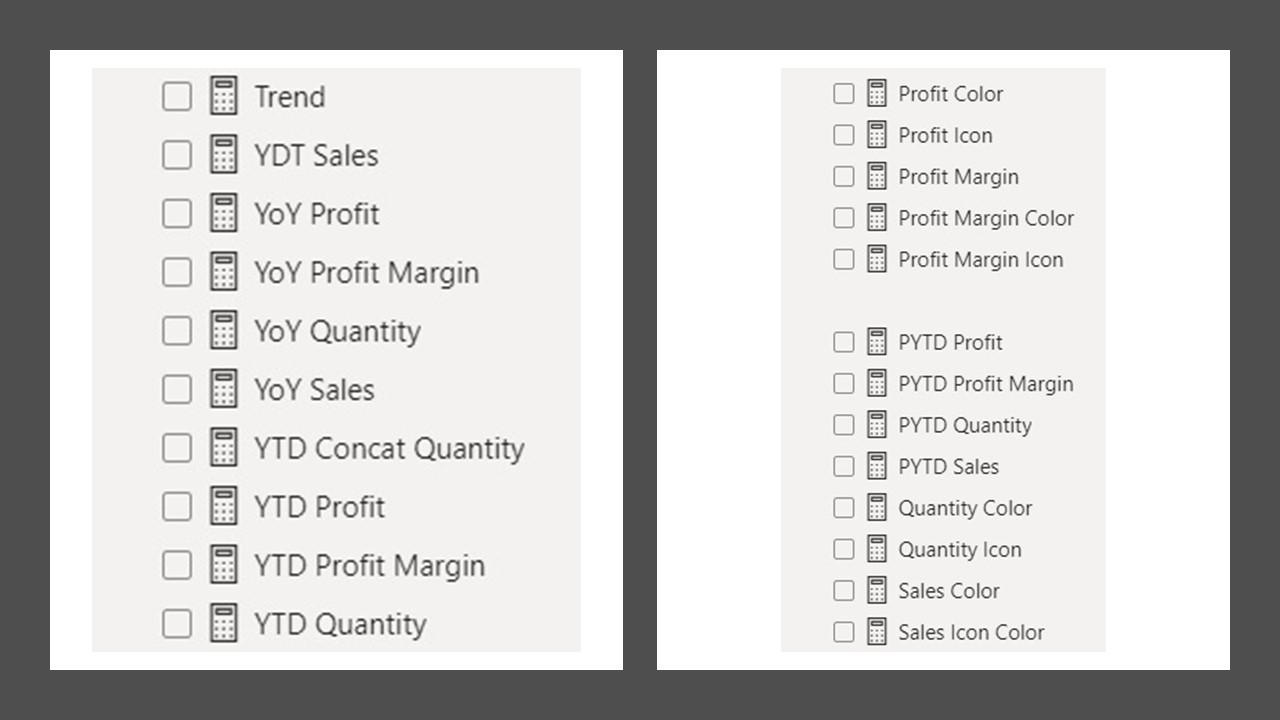
In order to have this visualization a bunch of measurements are added in the project. Most of them are used only to create trend icon and color. Here are the all measurements that are used for this visualization.
In this part YTD (Year to Date) Profit part will be explained, and the rest (YTD Sales, YTD Quality and YTD Profit Margin)
are calculated in the same way.
YTD Profit = TOTALYTD(SUM(ecommerce_data[profit_per_order]),'Calendar'[Date])
In order to get YoY(Year over year) YTD Profit and PYTD (Past year to date) are needed:
YoY Profit = ([YTD Profit]- [PYTD Profit])/[PYTD Profit]
And finally for trend icon and color the following logic has been applied respectively:
Profit Icon = var positive_icon = UNICHAR(9650)
var negative_icon = UNICHAR(9660)
var result = IF([YoY Profit]>0, positive_icon, negative_icon)
return result
Profit Color = IF([YoY Profit]>0, "Green", "Red")
However all the other measurements have been obtained similarly with the above-mentioned logic, Profit Margin is calculated in this way:
Profit Margin = SUM(ecommerce_data[profit_per_order])/SUM(ecommerce_data[sales_per_order])
To conclude this is a dynamic dashboard that mainly shows YTD sales, YTD Profit, YTD Quantity, YTD Profit Margin by several aspects which were mentioned in this page.